7 Best Indicators for Futures Prediction: Prop Firm Edge (2026)
Material update: 15 October 2026: specifically identified source references, unsupported own-product/result qualifications or account-rule wording corrected. Existing publication status and URL retained.

While no single indicator perfectly predicts the future, a combination of robust technical analysis tools, when applied with a strong understanding of risk management, offers the best predictive edge for future trading. Key indicators like Moving Averages, RSI, MACD, and Pivot Points provide critical insights into market direction, momentum, and potential turning points, especially crucial for prop firm traders aiming for consistency and rule adherence.
- Trend indicators (e.g., Moving Averages) identify sustained market direction.
- Momentum indicators (e.g., RSI, MACD) gauge the strength and speed of price movements.
- Volatility indicators (e.g., Bollinger Bands) help define trading ranges and potential breakouts.
- Price action and support/resistance (e.g., Pivot Points) reveal critical supply and demand zones.
- Effective risk management is paramount, especially for prop firm evaluation rules.
Why "Best" Is a Misnomer: The Context of Prediction
No single indicator can definitively claim the title of "best" for future trading prediction because market dynamics are complex, influenced by countless variables beyond any single mathematical formula. The effectiveness of any indicator is highly dependent on the market context, the specific asset being traded, the trader's strategy, and their risk tolerance.
Instead of searching for a magical crystal ball, skilled traders understand that indicators are tools designed to help interpret market data, identify probabilities, and confirm biases. They provide a statistical edge, not a guarantee. For instance, a simple moving average might indicate a strong trend, but without considering volume or momentum, that signal could be a trap. The true predictive power emerges from combining multiple indicators and integrating them into a comprehensive trading plan.
The Role of Indicators in Prop Firm Trading Success
For prop firm traders, indicators play a critical role not just in identifying trade entries, but crucially, in managing risk and ensuring consistency to meet evaluation targets. Prop firms like FTMO, FundedNext, and TopStep impose strict rules regarding daily drawdown, maximum loss, and consistency, making precise entry and exit strategies paramount. Indicators help traders define these parameters objectively.
For example, a trader might use a Volume Weighted Average Price (VWAP) as a dynamic support/resistance level to confirm entries, aiming for trades with a higher probability of moving in their favor, thus reducing the likelihood of hitting a daily drawdown limit. The objective signals provided by indicators help remove emotional bias, which is often a significant hurdle for traders trying to pass prop firm challenges. Our research at JPTradingCapital consistently shows that strategies incorporating objective indicator-based rules tend to perform more consistently in simulated prop firm environments.
Core Technical Indicators for Futures Prediction
A select group of technical indicators forms the foundation for effective future trading prediction, each offering a unique perspective on market behavior. Understanding their individual strengths and how they complement each other is key to building a robust trading strategy.
Trend-Following Indicators: Moving Averages and MACD
Trend-following indicators are essential for identifying the prevailing direction of the market, helping traders align with the path of least resistance. The most popular among these are Moving Averages and the Moving Average Convergence Divergence (MACD).
-
Moving Averages (MA): Moving Averages smooth out price data over a specific period, revealing the underlying trend. A common strategy involves using two MAs (e.g., 20-period and 50-period) and looking for crossovers. When the shorter-term MA crosses above the longer-term MA, it's often seen as a bullish signal, suggesting an upward trend, and vice versa for a bearish signal. For day trading futures, shorter period MAs (e.g., 9, 20) are often preferred. They are excellent for identifying the current trend and dynamic support/resistance levels. For more on general trading concepts, Investopedia offers comprehensive definitions.
-
Moving Average Convergence Divergence (MACD): The MACD is a momentum indicator that shows the relationship between two moving averages of a security’s price. It consists of the MACD line, a signal line, and a histogram. Traders look for crossovers between the MACD line and the signal line, as well as divergences between the MACD and price action. A bullish crossover (MACD line crosses above the signal line) can signal an upward momentum shift, while a bearish crossover suggests a downward shift. The histogram visually represents the distance between the two lines, indicating the strength of the momentum.
Momentum and Volatility: RSI and Bollinger Bands
Momentum indicators gauge the speed and strength of price movements, while volatility indicators help define the expected range of price fluctuations.
-
Relative Strength Index (RSI): The RSI is a momentum oscillator that measures the speed and change of price movements, ranging from 0 to 100. It's primarily used to identify overbought or oversold conditions. Readings above 70 typically suggest overbought conditions, potentially signaling a reversal or pullback, while readings below 30 suggest oversold conditions. For futures trading, the RSI can help pinpoint exhaustion points in a trend, offering potential entry or exit signals.
-
Bollinger Bands: Bollinger Bands consist of a simple moving average (the middle band) and two standard deviation bands above and below it. They measure market volatility and help identify potential price extremes. When prices hit the upper band, it might indicate overextension, and when they hit the lower band, it might suggest undervaluation. A "squeeze" in the bands (when they narrow) often precedes a period of increased volatility and a potential breakout, making them valuable for futures traders looking for explosive moves.
Support, Resistance, and Price Action: Pivot Points and Volume
Understanding key price levels and the underlying activity is fundamental for predicting future price movements.
-
Pivot Points: Pivot points are calculated based on the previous day's high, low, and close prices, providing critical levels of support and resistance for the current trading day. They are widely used by day traders to identify potential turning points or areas where price might consolidate. When price approaches a pivot point, traders watch for reactions, a bounce suggests support/resistance holds, while a break suggests continuation. Many prop firm traders incorporate pivots as a key component of their daily trading plan, as highlighted by resources like TopStep's trading education.
-
Volume: While not a traditional "indicator" in the same way as MACD, volume is an indispensable piece of information for future trading prediction. High volume accompanying a price move suggests conviction behind that move, increasing its validity. Conversely, a price move on low volume might be less sustainable. Significant spikes in volume at key support or resistance levels can signal strong institutional activity and potential reversals or breakthroughs. Volume analysis provides crucial context to price action and other indicator signals.
Beyond Single Indicators: Strategies for Confluence and Confirmation
Relying on a single indicator for future trading prediction is akin to driving with one eye closed; it offers an incomplete and often misleading view. The true power of technical analysis for prop firm traders lies in combining multiple indicators to achieve confluence and confirmation, significantly increasing the probability of successful trades.
Combining Indicators for Higher Probability Setups
A higher probability setup emerges when several non-correlated indicators provide the same signal, reinforcing a trading idea. For instance, a trader might look for a bullish MACD crossover to confirm a buy signal, but only if the price is also above a key Moving Average, and the RSI is moving up from an oversold condition. This layered approach filters out weaker signals and helps focus on setups with stronger underlying conviction. For example, a futures trader might combine:
- A 20-period Exponential Moving Average (EMA) for trend direction.
- RSI for momentum and overbought/oversold conditions.
- MACD for trend strength and potential reversals.
- Pivot Points for key support/resistance levels.
A high-probability long setup could involve price bouncing off a daily pivot point, staying above the 20 EMA, with RSI moving above 30, and a bullish MACD crossover. This multi-factor approach reduces false signals and helps traders achieve the consistency required by prop firms.
Integrating Price Action with Indicator Signals
While indicators are powerful, they are derived from price. Therefore, integrating raw price action analysis with indicator signals provides an even more robust framework for future trading prediction. Price action refers to the movement of a security's price plotted over time, often represented by candlesticks or bars. It tells a direct story of supply and demand.
For example, instead of blindly buying when the RSI crosses 30, a trader would wait for a bullish candlestick pattern (like a hammer or engulfing pattern) to form at a key support level, *then* confirm with the RSI moving higher. This synergistic approach ensures that indicator signals are validated by direct market behavior, offering a more nuanced and reliable predictive edge. For prop firm traders, this precision can mean the difference between hitting a profit target or breaching a drawdown limit.
The Prop Firm Edge: Indicators for Risk Management and Consistency
For individuals pursuing prop firm evaluations, indicators are not just about finding trades; they are critical tools for managing risk and fostering the consistency demanded by firms like FTMO, FundedNext, and E8 Funding. Adhering to strict daily drawdown and maximum loss rules is non-negotiable, and indicators can significantly aid in this.
Using Indicators to Avoid Daily Drawdowns
Prop firms enforce strict daily drawdown limits (e.g., 5% of initial balance), meaning traders must manage their risk meticulously throughout the trading day. Indicators can help by:
-
Defining Entry and Exit Points: Using indicators to identify precise entry points with clear invalidation levels (stop losses) helps minimize potential losses on any single trade. For example, entering a long trade only when price is above a key moving average and pulling back to it, with a stop loss just below that average, provides a defined risk profile. Similarly, indicators can signal when a trade is losing momentum or hitting strong resistance, prompting early exits to protect profits or limit losses before hitting a daily drawdown. This strategic approach is fundamental to passing prop firm challenges.
-
Confirming Trend Strength: Trading against a strong trend is a common way to incur rapid losses. Trend-following indicators like ADX or Moving Averages can help traders identify the prevailing trend's strength, encouraging them to trade with it rather than against it, thereby reducing the risk of being caught in adverse moves that contribute to drawdown. Avoiding low-probability trades is crucial for maintaining consistency and preserving capital.
Crafting Consistent Strategies for Evaluations
Prop firms also emphasize consistency, often requiring a minimum number of profitable trading days or a smooth equity curve. Indicators contribute to consistency by providing objective, repeatable signals.
-
Systematic Approach: A strategy built around clear indicator rules (e.g., "buy when RSI crosses 30 and MACD is bullish") allows for a systematic approach to trading. This reduces emotional decision-making, which is a major cause of inconsistency. By relying on a predefined set of conditions, traders can execute their plan without hesitation, leading to more uniform results. This systematic approach is a cornerstone of our work at JPTradingCapital, where we develop automated strategies specifically designed for prop firm rules.
-
Backtesting and Optimization: Indicators are ideal for backtesting, allowing traders to test their strategies against historical data. This process helps identify which indicator combinations and parameters have historically produced consistent results in futures markets. Prop firm traders can optimize their indicator settings to align with the specific profit targets and drawdown limits of their chosen firm. This data-driven approach is vital for developing a robust EA trading strategy.
Automated Trading and Predictive Indicators
The consistent and objective nature of technical indicators makes them perfectly suited for automated trading strategies, which are increasingly popular among prop firm traders and EA developers. Automated Expert Advisors (EAs) can execute indicator-based strategies with precision, removing human emotion and ensuring strict adherence to predefined rules.
How EAs Leverage Indicators for Future Trading
Expert Advisors, particularly those designed for platforms like MetaTrader 4 or MetaTrader 5, are programmed to monitor market conditions and execute trades based on specific indicator signals. For example, an EA can be coded to:
- Automatically enter a long trade when a fast Moving Average crosses above a slow Moving Average.
- Set a stop loss and take profit based on ATR (Average True Range) or fixed pips, determined by volatility indicators.
- Exit a trade if the RSI enters overbought territory, or if a specific volume threshold is met.
This automated execution ensures that every signal meeting the predefined criteria is acted upon, leading to a consistent application of the strategy. For prop firm traders, this consistency is invaluable for navigating daily drawdown rules and achieving the required profit targets within evaluation parameters.
JPTradingCapital's Approach to Indicator-Driven Automation
At JPTradingCapital, we specialize in building trading tools for prop firm traders, with our flagship JPTC EA Hub leveraging robust, backtested strategies. Our EAs are pre-configured with indicator-driven logic that respects common prop-firm rules, such as daily drawdown caps and maximum loss limits. For example, our EAs might use a combination of Moving Averages to confirm trend, RSI for momentum entry, and specific volume levels for exit confirmation, all while dynamically adjusting risk to stay within prop firm thresholds.
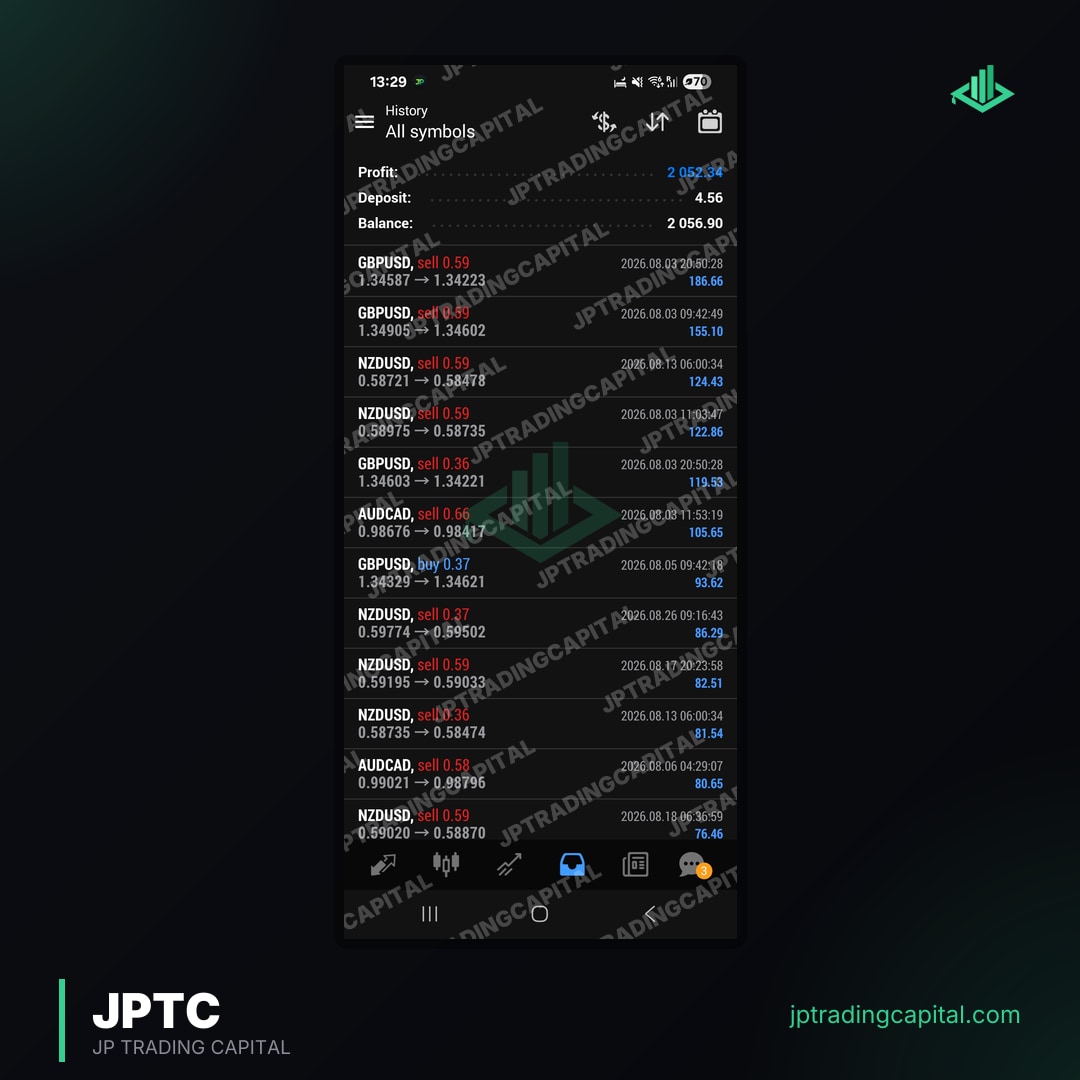
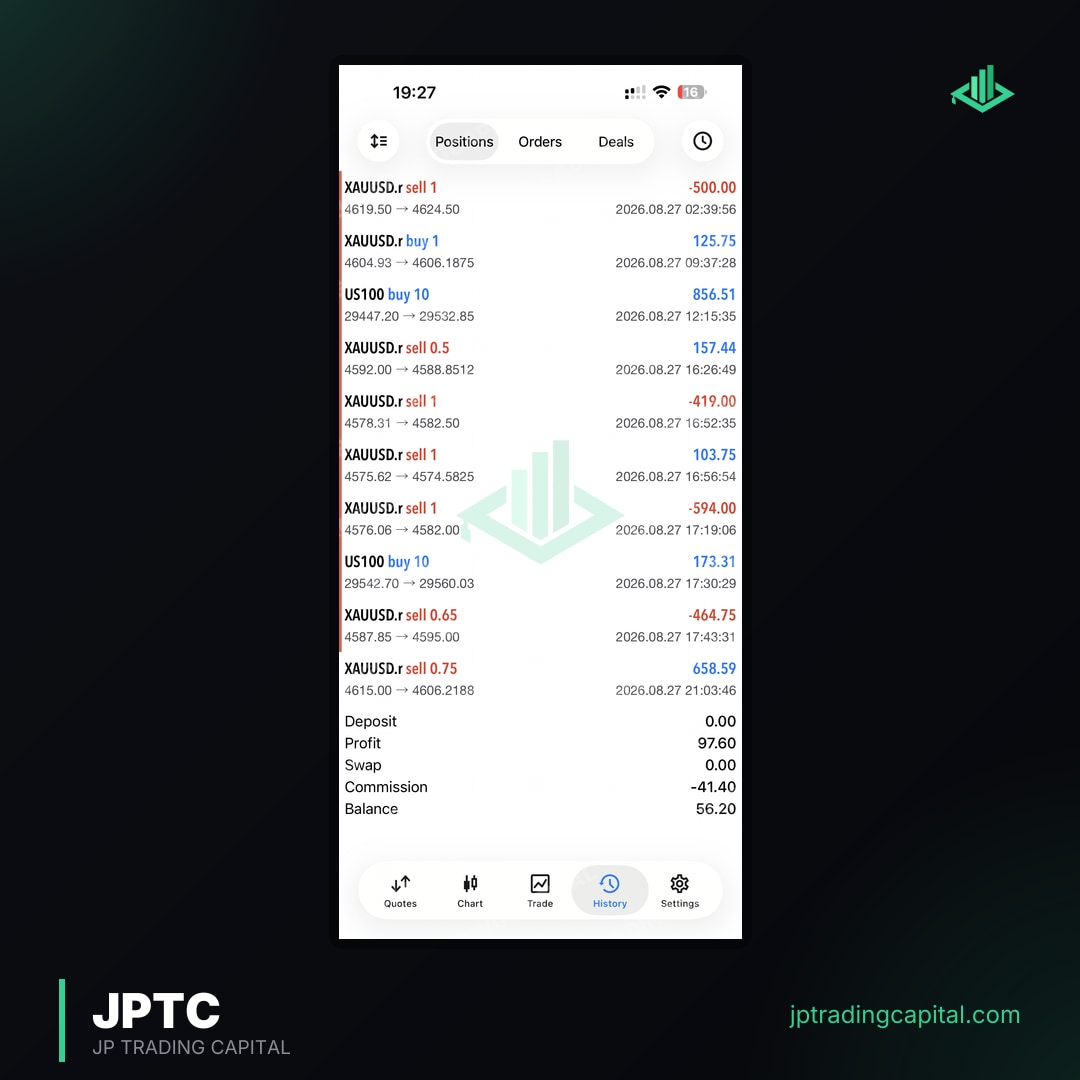
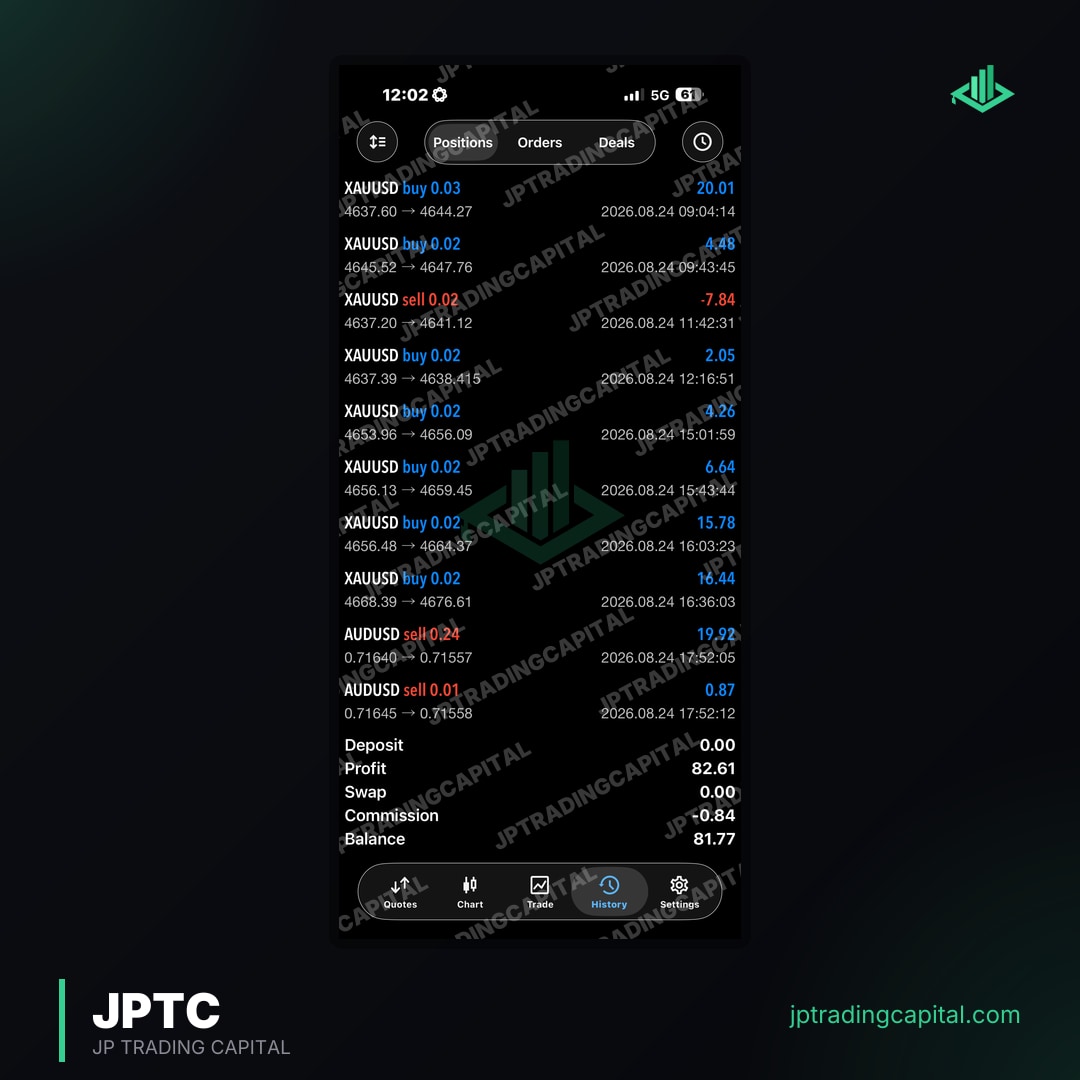
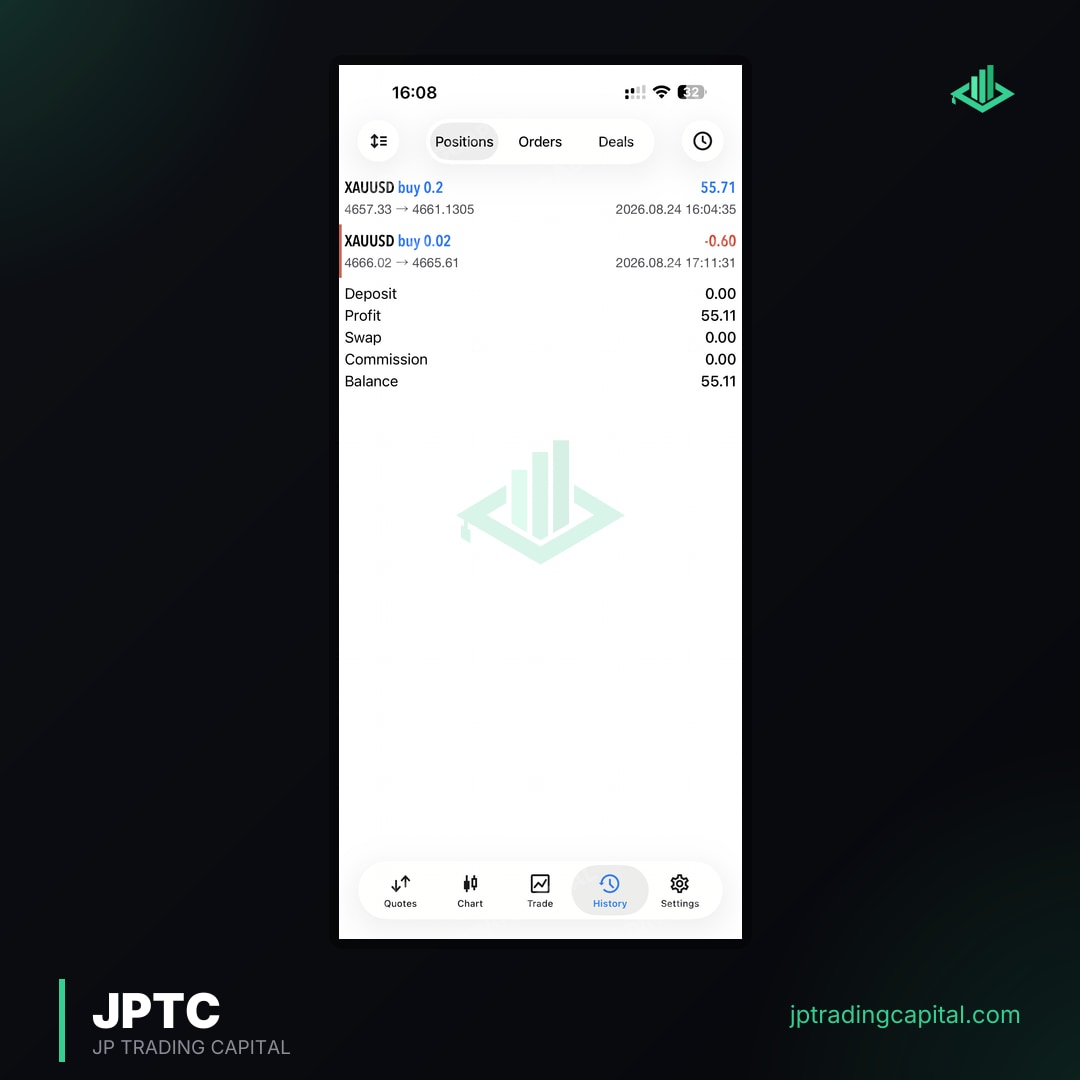
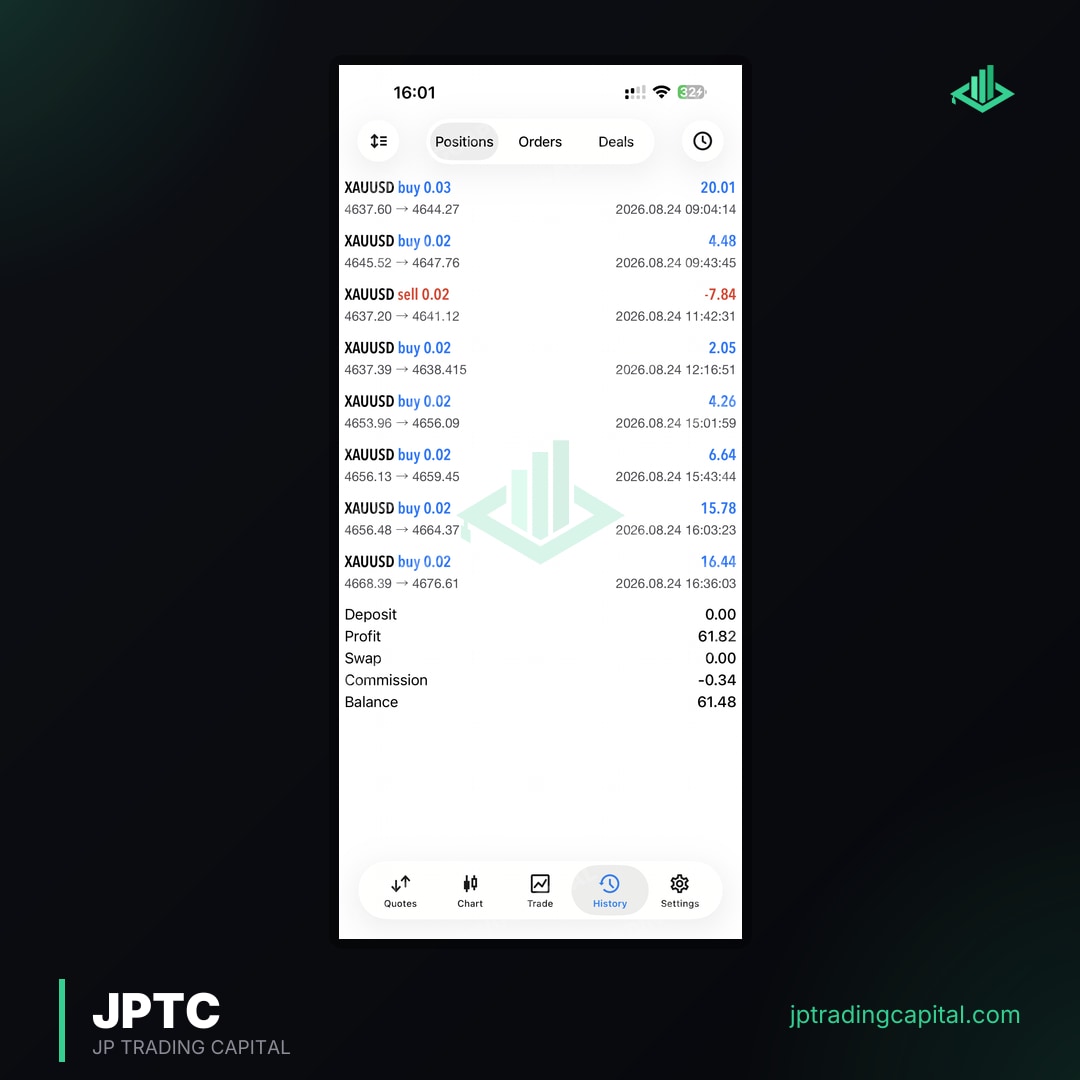
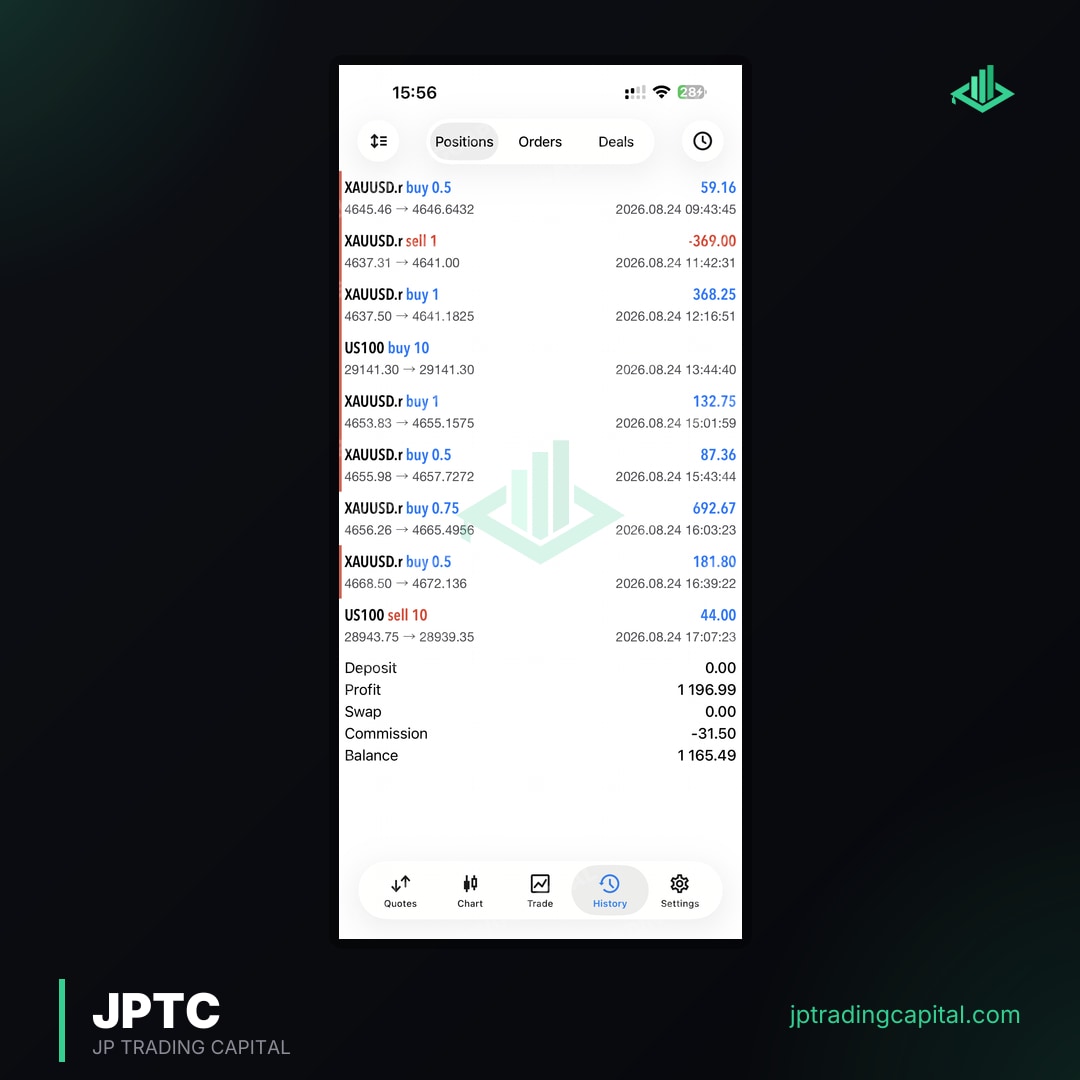
This systematic approach helps traders focus on passing evaluations across platforms like FTMO, FundedNext, FXify, TopStep, The5ers, and E8 Funding. The objective application of indicators through automation removes the psychological burden of manual trading, allowing for a more disciplined and consistent performance. JPTradingCapital publishes monthly figures from broker statements on its results page. The broker’s own account record is not an independent audit; these figures do not establish future performance or compliance for another strategy.
Advanced Predictive Concepts: Beyond Traditional Indicators
While traditional technical indicators form the bedrock of many trading strategies, the field of future trading prediction is constantly evolving, with advanced concepts emerging that go beyond simple mathematical formulas. These often involve more complex computational methods and data analysis.
Concepts like machine learning models, neural networks, and advanced statistical projections (such as Monte Carlo simulations) are being explored to identify intricate patterns and forecast potential price paths. These methods can process vast amounts of data, including non-traditional datasets, to uncover predictive insights that might be invisible to conventional indicators. While these tools are more complex and often proprietary, their existence highlights the continuous quest for a deeper understanding of market movements and future price prediction. For the average prop firm trader, understanding the core indicators and their confluence remains the most accessible and practical path to success.
What is the most reliable indicator for futures trading?
Can indicators predict exact future prices?
How do prop firm traders use indicators differently?
Are indicators useful for automated trading (EAs) in futures?
Related Articles
- Exact ES Micro Swing MR4 System: Pass Prop Firms in 2026 · Read more →
- Nyao Scalper MT5: Source Review and Test Limits · Read more →
- Trading Algorithm Portfolio Diversification Beyond Setfile Count · Read more →
- Trade Copier Offset Stop Loss and Take Profit · Read more →
- Trade Copier Broker Price Differences Explained · Read more →
- Multi-Market EA Validation Without Curve Fitting · Read more →
- Maximum Stagnation in an EA Backtest · Read more →
- EA Setfile Validation Release Cycle Explained · Read more →
- Best Straight to Funded Prop Firms: 5 Key Rules for 2026 Success · Read more →
- Exact FundedNext Futures Restricted Countries: 2026 Update · Read more →
Futures Challenge Preparation
Software, reviewed setfiles, a written risk plan and community access built around common evaluation rules. No software can guarantee a pass.
Get Started