7 Critical ES NQ Futures Technical Levels for Prop Firm Traders
Material update: 15 October 2026: Additional own-results verification/audit wording corrected to company-published broker-statement scope.

ES NQ futures technical levels are specific price points derived from past market action, such as support, resistance, and pivot points, which traders use to anticipate future price movements and make informed trading decisions. These levels are especially critical for prop firm traders aiming to manage risk, adhere to drawdown limits, and achieve consistent profitability across various trading challenges.
- Identify key support and resistance zones for strategic entry and exit.
- Use pivot points to gauge daily market sentiment and potential reversals.
- Apply moving averages to confirm trends and dynamic levels.
- Understand NQ's tech-heavy volatility versus ES's broader market stability.
- Integrate these levels into automated strategies for consistent execution.
What Are ES and NQ Futures, and Why Technical Levels Matter
ES and NQ futures are highly liquid, electronically traded contracts representing the S&P 500 and Nasdaq 100 indices, respectively, offering traders a direct way to speculate on the performance of the broader U.S. stock market and its technology sector.
ES Futures: The S&P 500 E-mini
The E-mini S&P 500 futures contract, commonly referred to as ES, tracks the performance of the S&P 500 stock market index. This index comprises 500 of the largest U.S. publicly traded companies, offering broad exposure to the American economy. ES futures are known for their relatively smoother price action and high liquidity, making them a popular instrument for both institutional and retail traders seeking exposure to a diversified market.
NQ Futures: The Nasdaq 100 E-mini
Conversely, the E-mini Nasdaq 100 futures contract, or NQ, represents the Nasdaq 100 index, which consists of the 100 largest non-financial companies listed on the Nasdaq stock market. This index is heavily weighted towards technology and growth stocks, leading to NQ futures typically exhibiting higher volatility and faster price movements compared to ES. Traders often gravitate towards NQ for its dynamic swings and potential for rapid gains, though it also comes with increased risk.
The Importance of Technical Levels in Futures Trading
Identifying and understanding es nq futures technical levels is paramount for any trader, as these levels provide objective points of interest where price is likely to react. These levels are not arbitrary; they often represent areas where significant buying or selling pressure has occurred in the past, leading to potential support (price bounces up) or resistance (price bounces down) in the future. For prop firm traders, precise identification of these levels is critical for managing risk, setting stop-losses, defining profit targets, and ultimately adhering to the strict drawdown and consistency rules required to pass evaluations and maintain funded accounts.
Core ES NQ Futures Technical Levels Every Trader Should Know
Successful trading in ES and NQ futures hinges on the ability to identify and interpret various technical levels that influence market behavior, providing strategic insights for entry and exit points.
Support and Resistance Zones
Support and resistance zones are fundamental es nq futures technical levels that represent price areas where buying or selling interest is strong enough to halt or reverse a price trend. Support is a price level where a downtrend can be expected to pause due to concentrated demand, while resistance is a price level where an uptrend can be expected to pause due to concentrated supply. These zones are identified by connecting previous swing highs (resistance) and swing lows (support) on a chart and are often more effective when viewed as zones rather than exact lines, accounting for market noise.
Pivot Points
Pivot points are calculated based on the previous day's high, low, and closing prices, providing a predictive framework for potential support and resistance levels for the current trading day. They are particularly popular among day traders for identifying intraday turning points and determining market sentiment. Different types of pivot points exist, such as Classic, Fibonacci, and Camarilla, each with its own calculation methodology, but all serve to highlight potential areas of price reaction. For instance, if NQ opens below the daily pivot, it might signal a bearish bias for the day.
Moving Averages
Moving averages smooth out price data over a specific period, helping to identify trends and dynamic support/resistance levels. Common types include Simple Moving Averages (SMA) and Exponential Moving Averages (EMA), with EMAs giving more weight to recent prices, making them more responsive. When price is above a moving average, it often indicates an uptrend, and the moving average itself can act as dynamic support. Conversely, when price is below, it suggests a downtrend, with the moving average acting as dynamic resistance. Crossovers of different period moving averages (e.g., a 50-period EMA crossing above a 200-period EMA) are also popular signals for trend changes.
Fibonacci Retracement and Extension Levels
Fibonacci retracement levels are horizontal lines indicating where support and resistance are likely to occur, based on the mathematical sequence discovered by Leonardo Fibonacci. Common retracement levels are 38.2%, 50%, and 61.8%, derived from a significant price move. Traders use these to anticipate where price might pull back before continuing its trend. Fibonacci extension levels, such as 127.2% and 161.8%, are used to project potential profit targets beyond the initial price move. The application of Fibonacci levels provides a unique perspective on potential turning points that align with natural market rhythms.
Volume Profile and High Volume Nodes (HVNs)
Volume profile is an advanced charting tool that displays trading activity over a specified price range at specific price levels, rather than over time. High Volume Nodes (HVNs) within the volume profile represent price levels where a significant amount of trading volume occurred, indicating strong agreement between buyers and sellers. These HVNs often act as strong es nq futures technical levels of support or resistance, as large orders were transacted there, suggesting potential future price congestion or reversal points. Conversely, Low Volume Nodes (LVNs) indicate areas of low interest, which price tends to move through quickly.
NQ vs ES: Understanding Their Unique Technical Behavior
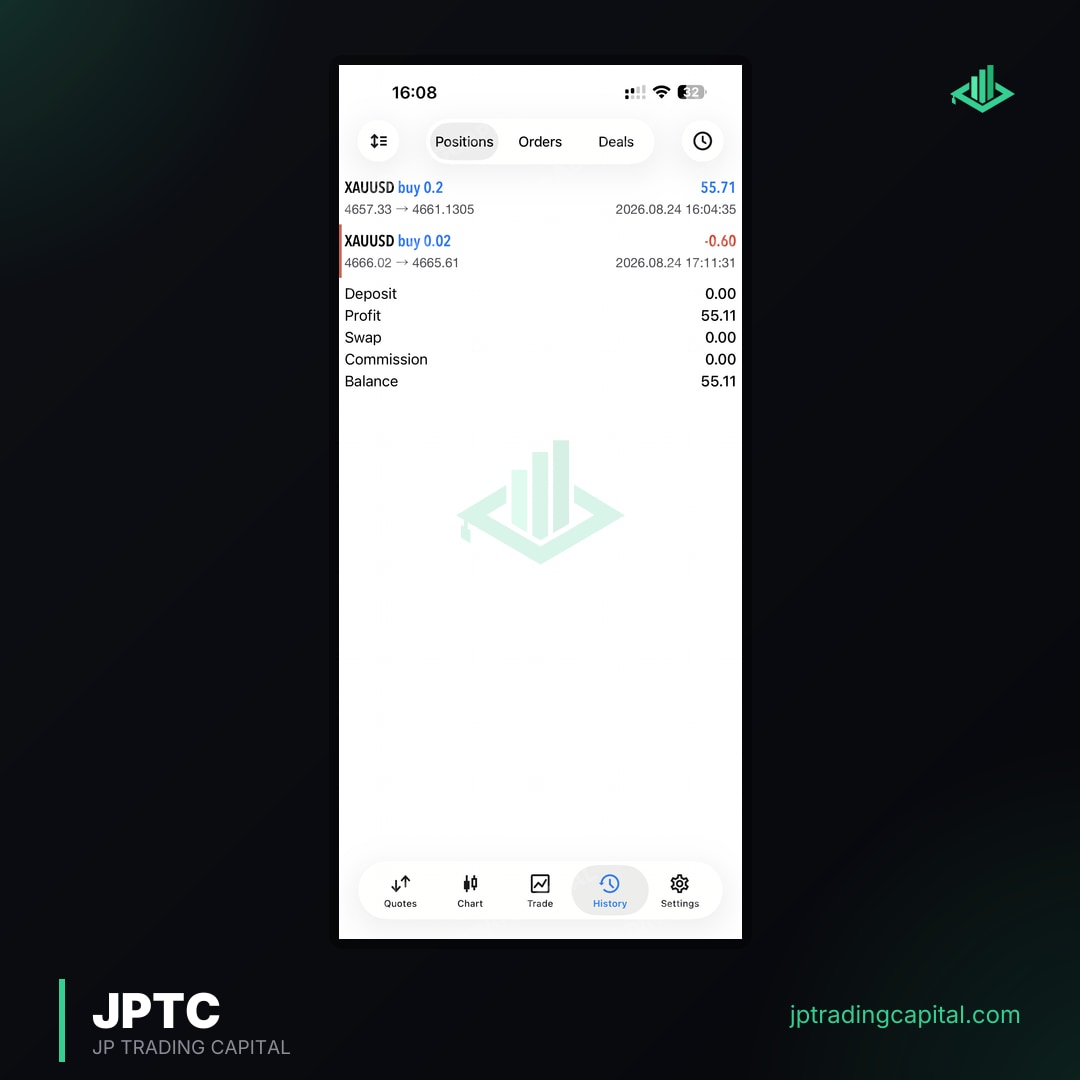
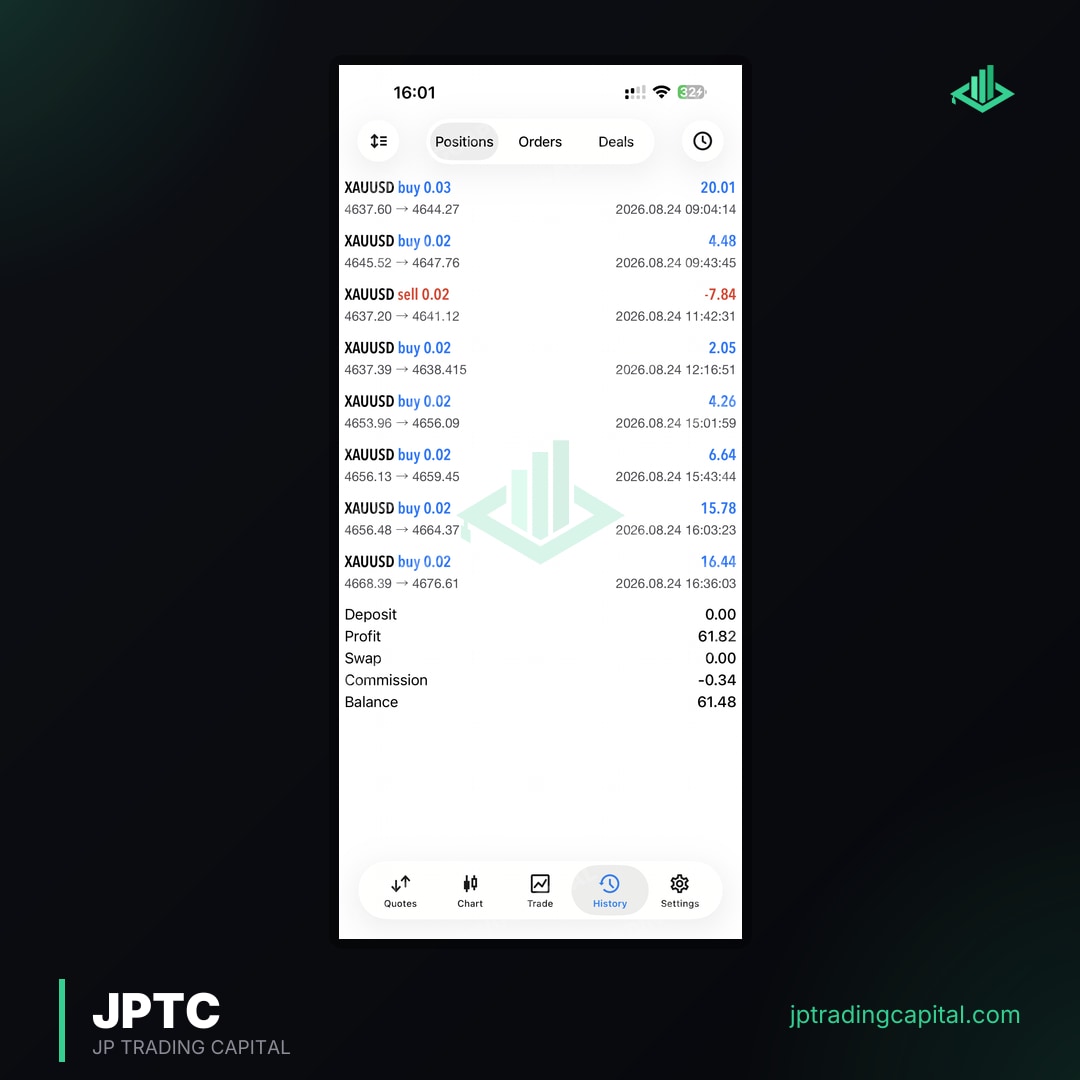
While both ES and NQ futures track major U.S. stock indices, their distinct market compositions lead to unique technical behaviors that traders must understand for effective strategy implementation.
Volatility and Reactivity
NQ futures typically exhibit higher volatility and react more sharply to news events, particularly those affecting the technology sector, compared to ES futures. The concentrated nature of the Nasdaq 100 index, with a significant weighting in a few large tech companies, means that individual company news or sector-specific sentiment can trigger more pronounced price swings in NQ. ES, representing a broader and more diversified economy, tends to move with a somewhat smoother trajectory, making it potentially less susceptible to extreme single-stock or sector-specific shocks. This difference in reactivity means that stop-loss placements and position sizing strategies may need to be adjusted accordingly when trading NQ versus ES.
Sector Concentration and Market Drivers
The primary driver for NQ is the performance of the technology and growth sectors, which can be highly sensitive to interest rate expectations, innovation news, and global economic sentiment impacting tech companies. ES, on the other hand, is driven by a wider array of economic factors affecting a diverse range of industries, including financials, healthcare, consumer staples, and industrials. This difference means that while both instruments can trend together, NQ might lead or lag ES on days where tech news dominates, or conversely, when traditional economic sectors are in focus. Understanding these underlying market drivers helps traders anticipate which instrument might be more affected by particular news cycles.
How Levels Differentially Apply
Due to NQ's higher volatility and often algorithmically driven price action, some traders observe that NQ can sometimes respect es nq futures technical levels with greater precision, often hitting key support or resistance zones before making a decisive move. This precision can be attributed to the prevalence of automated trading systems that are programmed to react to exact price points. ES, while still respecting technical levels, might exhibit slightly more "wiggle room" around these zones due to its broader market participation and potentially more discretionary trading influence. However, both instruments provide ample opportunities when technical levels are properly identified and integrated into a trading strategy.
Leveraging ES NQ Futures Technical Levels for Prop Firm Success
For prop firm traders, the disciplined application of ES NQ futures technical levels is not just about finding trades; it's a fundamental pillar for navigating stringent evaluation rules and securing a funded account.
Managing Daily Drawdown and Max Loss
Prop firms impose strict rules on daily drawdown and maximum loss, making precise risk management indispensable. By identifying key es nq futures technical levels of support and resistance, traders can strategically place stop-loss orders just beyond these zones, minimizing potential losses if a trade moves against them. For example, if a trader enters a long position at a strong support level, placing the stop-loss just below that support provides a logical exit point before a small pullback turns into a significant drawdown. This objective approach to risk management is crucial for staying within the limits set by firms like FTMO or FundedNext, preventing premature disqualification. Consistent application of these principles helps traders stay in the game and progress through evaluation phases. Learn more about passing these challenges effectively on our dedicated page.
Achieving Consistency Targets
Many prop firm evaluations emphasize consistency, requiring traders to show steady profitability rather than sporadic large gains. Trading around well-defined es nq futures technical levels promotes a repeatable and objective approach to trading. When strategies are built upon identifiable support, resistance, pivot points, and other levels, traders can develop a systematic methodology for entries, exits, and risk management. This systematic approach reduces emotional decision-making and fosters the kind of consistent performance that prop firms seek, demonstrating a trader's ability to manage capital responsibly over time.
Developing Robust Trading Plans
A comprehensive trading plan is essential for prop firm success, and technical levels form the backbone of such a plan for ES and NQ futures. A robust plan integrates the identification of these levels with position sizing, entry criteria, exit strategies, and risk management protocols. For instance, a plan might dictate taking a long trade on NQ only when it retests a confluence of a daily pivot and a 50-period EMA, with a stop-loss below the pivot and a target at the next significant resistance level. Such clarity removes ambiguity and allows traders to execute their strategy with confidence, knowing their actions are based on objective market analysis rather than fleeting emotions.
Automated Trading and ES NQ Futures Technical Levels
The precision and objectivity inherent in es nq futures technical levels make them ideal candidates for integration into automated trading systems, offering significant advantages for prop firm traders and EA developers.
The Advantage of Algorithmic Execution
Automated trading, through Expert Advisors (EAs) on platforms like MetaTrader 5, offers unparalleled precision and speed in executing trades based on predefined technical levels. Unlike human traders, EAs are immune to emotions such as fear or greed, ensuring that every trade is executed exactly according to the strategy's rules. This eliminates common trading errors like hesitation at entry, premature exits, or delayed stop-loss adjustments, which can be detrimental in fast-moving markets like ES and NQ. The consistent, objective execution provided by algorithms is a significant edge, especially when navigating the tight risk parameters of prop firm challenges.
Integrating Levels into Expert Advisors (EAs)
Expert Advisors can be programmed to automatically identify and react to various es nq futures technical levels. For example, an EA can be configured to recognize support and resistance zones based on historical price action, calculate daily pivot points, or monitor moving average crossovers. When price interacts with these levels according to the strategy's logic, the EA can automatically place trades, manage stop-losses, and set take-profit targets. The JPTradingCapital EA Hub, for instance, is designed with backtested strategies that respect prop-firm rules, leveraging such technical insights in EAs that you run on your own MT4 or MT5 terminal. Ready-made setfiles keep the technical setup short, so traders can focus on strategy development, and our EA solutions can help streamline this process.
Backtesting and Optimization
Before deploying any automated strategy that uses es nq futures technical levels, rigorous backtesting and optimization are essential. Backtesting involves running the EA on historical data to see how it would have performed under various market conditions. This process helps to validate the efficacy of the technical levels chosen and the rules built around them. Optimization further refines the parameters of the EA (e.g., period settings for moving averages, sensitivity for pivot point reactions) to find the most robust and profitable configurations. This data-driven approach ensures that the automated strategy is not only theoretically sound but also practically effective, providing the confidence needed for real-account trading. JPTradingCapital publishes monthly figures from broker statements on its results page. The broker’s own account record is not an independent audit; these figures do not establish future performance or compliance for another strategy.
Advanced Strategies for Confirming Technical Levels
Beyond simply identifying basic es nq futures technical levels, advanced traders employ confirmation techniques to increase the probability of successful trades and filter out weaker signals.
Multi-Timeframe Confluence
One of the most powerful confirmation techniques is multi-timeframe confluence, where a technical level identified on one timeframe is validated by its presence or alignment with a level on another. For example, a strong resistance level identified on a daily chart gains significant credibility if it also aligns with a pivot point or a Fibonacci retracement level on a 4-hour or 1-hour chart. When multiple technical levels converge across different timeframes, it indicates a stronger area of interest where a more significant market reaction is likely. This approach provides a higher conviction for trade setups and reduces the likelihood of false breakouts.
Price Action Confirmation
Price action refers to the movement of a security's price over time, plotted on a chart, and is a critical tool for confirming technical levels. Instead of blindly entering a trade when price simply touches a support or resistance level, traders wait for specific candlestick patterns or other price action signals that confirm the level is holding. For instance, a bullish engulfing pattern or a hammer candlestick forming at a support level suggests that buyers are stepping in, confirming the support. Conversely, a bearish pin bar or an evening star pattern at resistance indicates sellers are taking control. This wait-and-see approach filters out premature entries and provides stronger conviction.
Divergence with Indicators
Divergence occurs when the price of an asset moves in the opposite direction of a technical indicator, signaling a potential reversal or weakening trend at a key technical level. For example, if NQ price makes a higher high, but an oscillator like the Relative Strength Index (RSI) makes a lower high, it indicates bearish divergence, suggesting that the upward momentum is weakening despite price continuing higher. This can be a powerful confirmation signal when it occurs at a strong resistance level, hinting that the level might hold and price could reverse. Similarly, bullish divergence at a support level can confirm a potential bounce. Understanding divergence adds another layer of sophistication to confirming technical analysis signals.
Practical Tips for Trading ES NQ Futures Technical Levels
Effective trading of ES and NQ futures using technical levels requires not just knowledge, but also disciplined application and continuous refinement of one's approach.
Start with Higher Timeframes
Always begin your analysis on higher timeframes, such as the daily or 4-hour chart, to identify the most significant es nq futures technical levels. These longer-term levels carry more weight and are more likely to influence price action than levels identified on shorter timeframes. Once the major levels are marked, you can then zoom into lower timeframes (e.g., 15-minute or 5-minute) for precise entry and exit points, ensuring your intraday trades align with the broader market structure.
Mark Key Levels Clearly
Use clear visual cues on your charts to mark support, resistance, pivot points, and other crucial levels. Color-coding, different line styles, or text labels can help differentiate between various types of levels and their significance. A clean and well-organized chart makes it easier to quickly assess the market situation and react appropriately as price approaches these zones.
Wait for Confirmation
As discussed, avoid impulsive entries when price merely touches a technical level. Always wait for clear confirmation through price action (e.g., strong rejection candles, consolidation) or a confluence of multiple signals. This patience helps to filter out false breakouts and reduces the risk of entering trades against the prevailing momentum.
Practice with a Demo Account
Before trading with a funded account, practice identifying and trading es nq futures technical levels extensively on a demo account. This allows you to refine your strategy, test different approaches, and build confidence without risking capital. A demo environment provides a safe space to make mistakes and learn from them, ensuring you are well-prepared for the psychological and practical demands of real-account trading.
Journal Your Trades
Maintain a detailed trading journal where you record every trade, including the technical levels you identified, your entry and exit points, the reasons for your decisions, and the outcome. Reviewing your journal regularly helps you identify patterns in your trading, understand what works and what doesn't, and continuously improve your ability to leverage technical levels for profitable outcomes. This reflective practice is invaluable for long-term growth as a trader.
Conclusion
Mastering es nq futures technical levels is a cornerstone for success in futures trading, particularly for prop firm traders navigating stringent rules. By understanding the nuances of support, resistance, pivot points, and advanced concepts like volume profile, traders gain a profound edge in anticipating market movements. The distinct behaviors of ES and NQ futures demand tailored approaches to these levels, while their integration into automated strategies offers unmatched precision and discipline. For those committed to passing evaluations and achieving consistent profitability, JPTradingCapital provides the advanced tools and expertise to leverage these technical insights effectively, empowering traders to execute strategies with confidence and algorithmic precision.
What are the primary differences between ES and NQ futures?
Related Articles
- Reddit Traders on Futures Compliance: 7 Key Takeaways · Read more →
- Exact XAUUSD Trading Hours 2026: Prop Firm Strategy Guide · Read more →
- XAUUSD Trading Hours: 7 Critical Times for EAs [2026] · Read more →
- Passing FTMO Challenge: 5 Key Rules for Automated Trading · Read more →
- Pass Forex Challenge, Pay Later: How 3 Firms Offer Funded Accounts · Read more →
- 5 Top Futures Prop Firms Like Topstep in 2026: Expert Review · Read more →
- Best Futures Prop Firms 2026: Reddit Insights & EA Strategies · Read more →
- Best Retail Traders in 2026: Strategies for Prop Firm Success · Read more →
- Beginner Futures Prop Firms: Top 5 Easiest in 2026 · Read more →
- Do AI Trading Bots Work for Forex in 2026: Real Results & Prop Firm Edge · Read more →
Futures Challenge Preparation
Software, reviewed setfiles, a written risk plan and community access built around common evaluation rules. No software can guarantee a pass.
Get Started